
Behavioral Biases: The Final Frontier
As earnings season approaches, we look at academic literature and Novus tools that can help asset managers deter behavioral biases.

The concept of "behavioral bias" has crept into the dialogue of financial practitioners. Fund managers increasingly sound like yogis, describing their path to self-actualization. And with good reason. Behavioral bias has been a continuous detractor of alpha, and the past ten years have been a case study proving its damaging effects. With active managers broadly underperforming passive indices after the financial crisis, there has been ample room for this self-reflection.
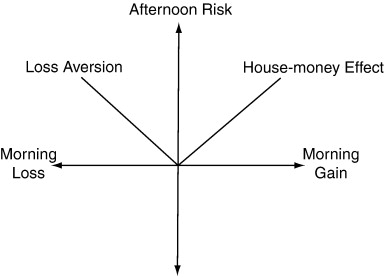
What then do we mean by behavioral bias? For that, we can turn to the research of Daniel Kahneman and Amos Tversky. Their pioneering research into the field of behavioral economics created a foundation for this area of inquiry, which has spread into finance like wildfire. How many biases have been documented? This fantastic chart (Figure 1), which I have seen hung up in more than one client office, is a testament to the field's depth:

Behavioral Economics’ Attack on Rational Models
Economics has always been grounded on rational models, or utility theories. Economists expect humans to behave rationally based upon an expectation of economic outcomes. Kahneman and Tversky began to subvert this assumption with Prospect Theory (circa 1979), by simply testing whether people are truly rational with their economic decisions. For example, do individuals treat losses the same as gains? By demonstrating that they do not, they were able to uncover biases—in this example, one called Loss Aversion (more on that)—associated with economic decisions.
At Novus, we develop tooling and methods of analysis to quantify the drag on investment returns through biases. Researchers Lucy Ackert, Narat Charupat, Bryan Church, and Richard Deaves (“ACCD”) studied this as well through a hypothetical market experiment in 2006. Their paper, “An Experimental Examination of the House Money Effect in a Multi-Period Setting,” provided empirical evidence for market participants on a concept called the House Money Effect, or the tendency to enter into riskier bets the higher the profits accumulated in more recent periods. Their worked stemmed directly from Kahmenman and Tversky’s Prospect Theory as well.
The ACCD experiment tested the price for which subjects would pay for an asset that provides a probabilistic dividend. The test subjects were university students with a business/finance focus. They tested this hypothesis under two principal controls: one with a lower starting level of nominal assets, and the other with a higher starting level of cash on hand. They found evidence that students were willing to pay more for the same asset when they started with more capital to begin with, even though the expected value of the asset had not changed. This is broadly referred to as a “Found Money” bias.
The translation of this to asset management is how portfolio managers treat positions if there is unrealized gain associated with the name. That is, what the propensity is to buy or sell the security given that an asset has already performed well in their portfolio. From a purely utility standpoint, it shouldn’t matter. Every day is a reevaluation of the security’s expected return. Whether or not you lost money, just entered, or have made significant money in the name doesn’t impact its future viability as an investment. Yet what the study found is that recent history is in fact swaying rational assessment.
Of course, some of this is biased by frictional cost such as tax consideration, but at the heart of it, study after study shows that positions with embedded gains are valued differently than those with no gains associated. As a portfolio manager, these positions feel like you are playing with “house money” rather than with your NAV.
One of the most common ways this bias is manifest is in how position sizing is regulated through portfolio construction rules. Often times portfolio managers have strict limits on position-size entries but treat the organic fluctuation of position size differently; e.g., the PM will initiate her highest conviction positions up to 5% but will allow them to grow organically to 7.5% before a rules-based trimming. This may make sense, as it ensures there are no blind spots to one’s process before adding weight into the portfolio. But it also demonstrates how PMs may treat unrealized PnL differently when it impacts position size.
Uprooting Deception
So how do we control for this?
The most pernicious quality of behavioral biases is how they teach us to fool ourselves. That is where data and unbiased analytics provide a sober assessment of what is truly going on.
For example, portfolio managers can check whether measures of risk at the portfolio level tend to correlate with cumulative profits on a look-back window. The logic being that “the more money I made, the more I am able to bet.” This is something which many asset managers are doing today with the Novus Platform’s key characteristics, where key portfolio properties (like risk or cumulative profits on a custom trailing window) can be easily calculated, displayed against each other, and tested to inspect the presence of bias.
Novus also recently released a cutting-edge Event Analysis engine. This tool allows users to answer questions about how single securities, pockets of the portfolio, and the aggregate portfolio behave before and after events. This method of analysis allows us to see patterns in our behavior and explore our biases associated with any event.
Earnings and Novus Event Analysis
Let’s take company earnings as an example. These are some of the most important events at the individual security-level, and they can often shape a portfolio’s excess return. Given the violent move that securities can have right after an earnings announcement, portfolio managers will often hedge their positions with short-term options designed to mitigate the impact of an “earnings miss.” This acts as a form of portfolio protection if a manager wants to digest the information provided by the earnings report prior to deciding her forward-looking view on the security.
Imagine if this PM hedges earnings systematically across the portfolio with short-dated options. The premium associated with this could be meaningful to the total portfolio performance. The first question to ask is: does the strategy work? Well, these options don’t always fall in the money, given the unknown magnitude of the earnings reaction, as well as the active choice of picking a strike. To properly understand the impact of PnL, one needs to be able to aggregate these options at the issuance level, and tag them so they can be sliced and diced. The Novus platform has always been able to provide this type of analysis. Through our careful analysis of the portfolio, let’s assume that the cost of putting on the protection is 20bps annualized, spent on these short-dated options.
With Event Analysis functionality, a Novus user can now aggregate this information along with their portfolio’s return characteristic prior to, or after earnings. In a sense, they are measuring the base case of the event throughout their history.
Let’s take a sample portfolio and analyze all positions held over a 5 year period. The event engine will center each of these positions and their associated earnings date onto a single fulcrum, which we denote as time = 0. From there, we can analyze the behavior of each stock (and thus the portfolio composite) at an expanding time interval before and after the event occurs.
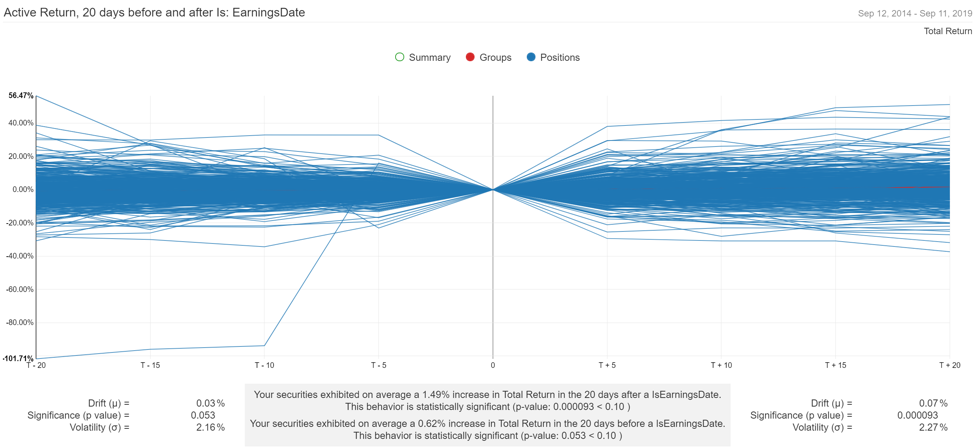
What does this tell us? Principally, the base-rate tendency of our portfolio names into every earnings event we have held. Let’s group this at the portfolio level so we can get a better sense of the aggregate impact. Below, we can see the preceding and following 20 days of every earnings announcement (t=0) for every security the portfolio has held for the last 5 years. What we find is a noticeable move up the following day (t=1), as well as a continued drift following the announcement. This phenomenon is sometimes called Post-Earnings Announcement Drift, an anomaly initially discovered by researchers Ray Ball and Philip Brown in 1968.
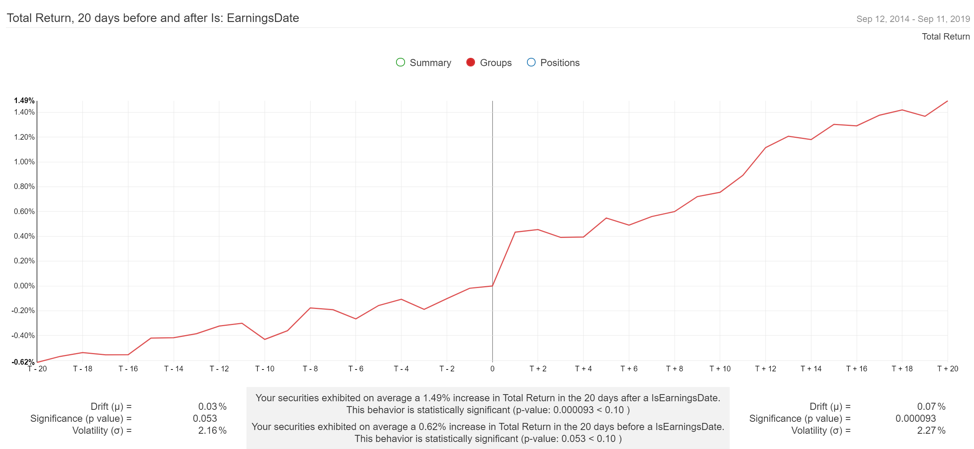
The portfolio manager who systematically spends 20bps on these short-dated options now has aggregate data to create base rates. These base rates can demonstrate that the post-earnings move in her portfolio has, on aggregate, been positive for t+1 (the following day), all the way through t+20. That is premium best spent somewhere else (perhaps on calls!). This is information every portfolio manager should have. If you'd like to see a demo of Event Analysis, hit "Request Demo" in the footer below.