Exposing Exposures: How a Degree of Freedom Becomes a Curse
Manager returns can be explained by the decisions managers make surrounding exposure, category, security selection, position sizing, and trading.


Five Degrees of Freedom
The decision process followed by asset managers can be described as a waterfall, gradually flowing from high-level choices at the portfolio level, down to single positions entered or exited (or the other way around). These steps are independent yet interlinked with each other in determining overall performance.
Being able to understand how much value each of these steps contributes or detracts is increasingly important, as the financial industry steers away from what has been the source of many wrong investment decisions—past returns. This is easier said than done. Without the help of a sound analytic framework, it is very easy to miss the mark.
Over the years, we have identified five main degrees of freedom which asset managers can leverage to generate returns. While they apply to all strategies and styles, we'll introduce them in the context of Equity Long / Short strategies for sake of simplicity. We refer to these degrees of freedom as the Novus Framework, whose elements are:
- Exposure Management: The ability to generate returns by moving gross and net exposures dynamically over time.
- Category Rotation: The dexterity in deploying exposures to the right asset class, geography, industry sector or, any other market partition.
- Security Selection: The skill of choosing a stock, or an investment idea more broadly, which will outperform others.
- Position Sizing: The competence to understand which positions offer the best upside potential and should therefore be over-sized with respect to others.
- Trading Acumen: The skill to adjust position sizes tactically around key events (e.g., earnings) to generate extra returns via trading compared to a buy-and-hold portfolio.
Or Maybe Four and a Half
Applying the Novus Framework to thousands of portfolios reveals a paradoxical pattern. While many asset managers actively move exposures, very few of them exhibit persistent skill at generating returns via this degree of freedom. To determine this, we compared portfolios to a re-scaled equivalent where exposures are held constant over time. In such a scenario, most actual portfolios tend to underperform their re-scaled equivalent, suggesting that skillful and intentional exposure management is an uncommon occurrence.
The Exposure Conundrum
Why is it so hard for portfolio managers to consistently add value by actively changing exposures? We argue that it is due to the difference in market dynamics between rising and declining markets. Like airplanes reaching cruising altitude, markets tend to rise in orderly fashion and for prolonged periods of time. In fact, volatility is typically lower during rising markets. Also like airplanes, markets tend to plummet quickly when problems arise.
If one could time net exposure perfectly, the negative consequences of these crashes would be avoided without missing the benefits of the rising phases. Reality, unfortunately, is quite different—not only because it is not so easy to tell apart a small correction from the beginning of a crisis, but also because it takes time to execute a marked change of strategy.
Trying to time the markets by adjusting the net exposure is therefore quite similar to driving a racing car on a dark and foggy road. When we hit the brakes because market conditions are deteriorating, it probably is too late, and when the road ahead of us is finally free, we will need a bit of time before accelerating again. Avoiding sharp slowdowns and accelerations, consequently, can be the best choice when we don't know when the next bend in the road will be. In other words, portfolio managers are better off keeping exposures constant, and focusing on other degrees of freedom.
"Running to Stand Still"
"Running to Stand Still" is of course the essential, often neglected, lyrical poem within Joshua Tree, the album which marked the zenith of U2's artistic trajectory, beginning with with Boy and War. (Yes, we'd argue Achtung Baby and what came next as a re-birth and orthogonal change of direction.)
If we believe that higher returns can be achieved by keeping exposure constant over time leads, active effort is then required, as market movements are constantly causing exposure fluctuations. Ironically, you have to keep running just to stand still.
To maintain a constant level exposure, portfolio managers will have to sell when the markets are going up and buy when the markets are plummeting. In the next section, we will prove mathematically that the lower the net exposure, the more dynamic the re-balancing effort ought to be.
What Can Be Done, Mathematically
Assume an ideal portfolio with a simple balance sheet where, at every point in time, Assets Under Management are AUM[t] = L[t] + C[t] – S[t]. The elements on the right-hand side of the equation represent, respectively, the value of the long book, the amount of cash and the value of the short book. The simplification lies in the fact that the portfolio does not have debt; i.e., D[t] = 0 ∀t. By definition, the value of the net exposure in this context is simply:

Since we are after the impact of broader market movements, we will make a rather strong assumption here and state that the long and short books move with the broad market over time,

where r[L,t], r[S,t] and r[m;t] are the returns of the long book, the short book, and the market respectively. Naturally, this is not what portfolio managers hope for—they aim to see their longs rising more than the reference market, and their shorts fall. That said, because we are not interested in assessing the impact of an investor's skills in terms of stock selection in this particular model, this assumption is reasonable. This is equivalent to saying that market movements over time tend to be higher in magnitude that stock dispersion within sector; i.e., r[L,t] – r[m,t] < r[m;t]. Same is true if you switch r[L,t] with r[m;t]. While this is not true (otherwise active managers would not have a purpose), the assumption does not take away from the fact that exposure management, if done poorly, can trump good stock selection. In addition, our conclusions hold in an even stronger form for r[L,t] > r[m,t] > r[s,t], but lack the clarity of an elegant close formula. Therefore, for the purpose of this article, we will go ahead with the aforementioned assumption. We will also assume that C[t] does change over time, which is more than legitimate in a zero-interest-rate environment. Finally, we assume no inflows / outflows between t and t+1.
One rather obvious initial finding we have is the following:
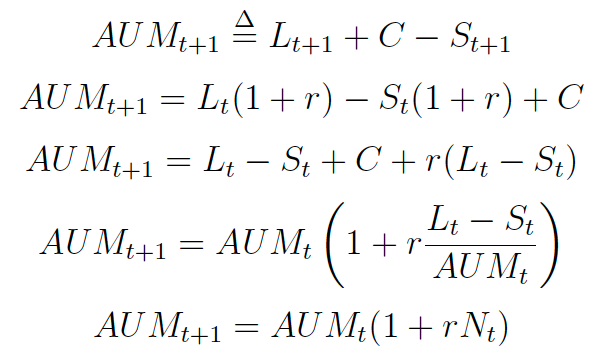
This new expression is particularly handy to express the evolution of G[t] and N[t] from one period to the following one, as we have that:
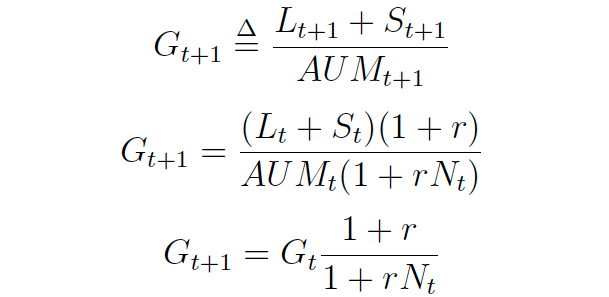
And subsequently, following very similar steps:

Under the assumption that N[t] does not 0, we can define:

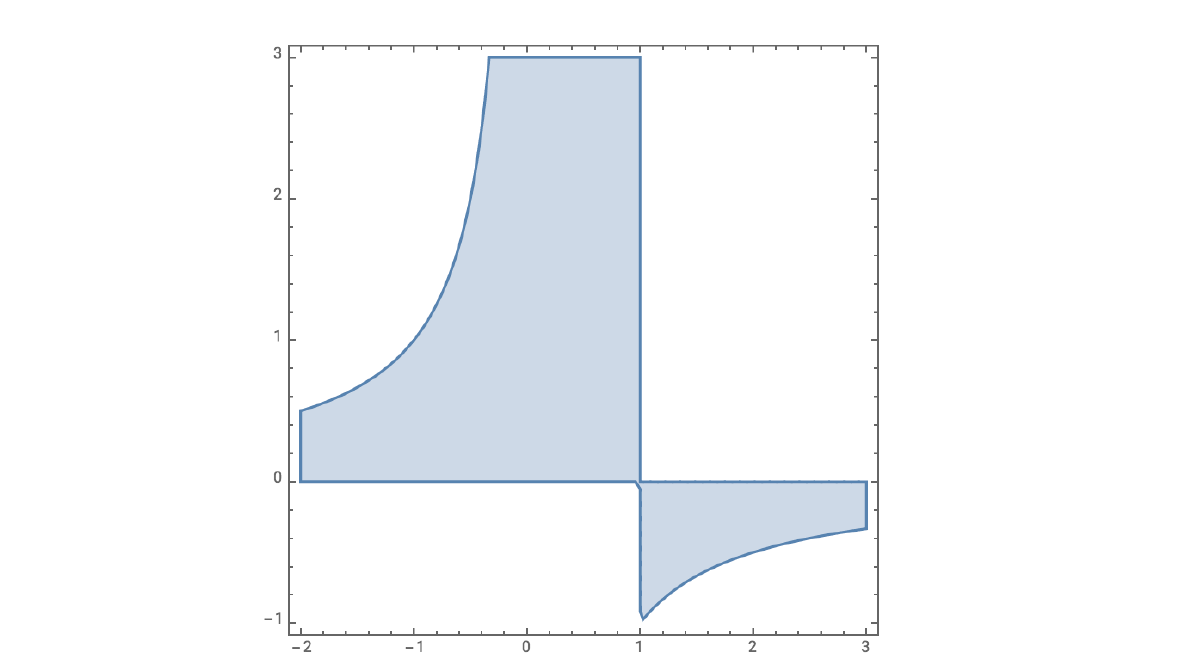
It is interesting to note that gross and net exposure changes depend on the returns between the periods r, as well as the beginning net exposure N[t]. Figure 1 shows the solution of the inequality v[t] > 1. Shaded and white areas represent sections where v[t] > 1 and v[t] < 1 respectively. We notice that v[t] = 1 if N[t] = 1 or r = 0.
The latter is trivial, so let’s focus on the insights emerging from the former: net exposure of 100% is an equilibrium point. That is, N[t] and G[t] will remain constant, regardless of r. In other words, if a portfolio managers' intent was to keep gross exposure constant and net exposure constant and equal to 100%, no effort is needed, as exposures will self-adjust automatically regardless of market movements. The equation governing v[t] also shows that, the further N[t] strays away from 100%, the more active trading will be needed to keep exposures constant and equal to their desired set-points.